









A sales and marketing dashboard that shows what's working
Sales and ad spend, side by side.
Prefer to talk it through? Book a call
 DemandLabs
 CosmeticComplyEventAnalytics



Updated7:00
Yesterday's sales inSales and ads in one dashboard
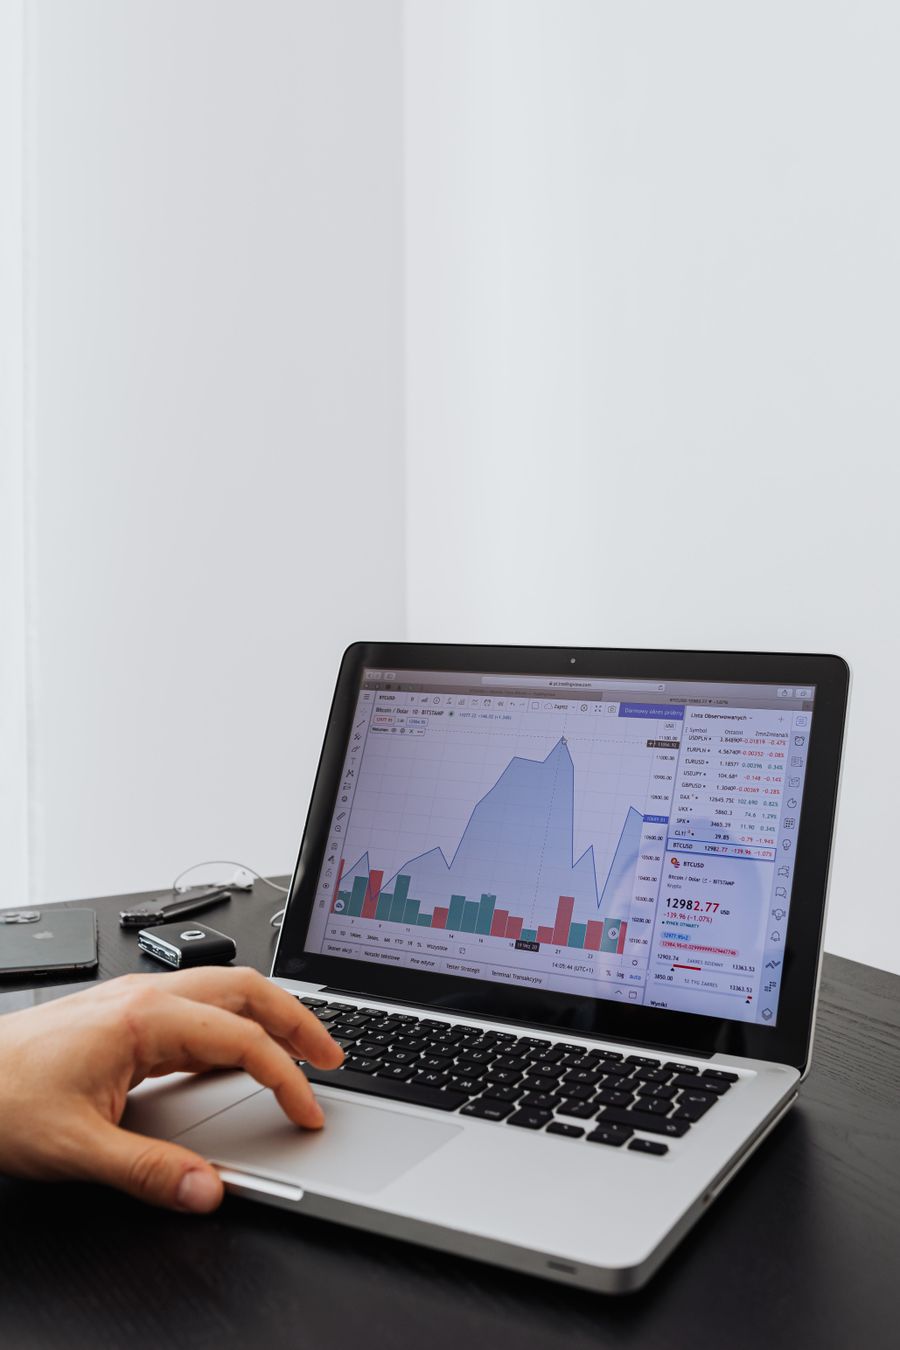
Sales figures and ad data usually sit in separate apps. We connect them into one dashboard that updates itself.
- Store, ads and analytics connected
- Updated automatically
- One login

Talk it through with the people who would build it
A free call with the FirmAdapt team. Bring your questions and the tools you use today.
Where customers come from
See which channels bring your customers and what each one costs you per sale.
- Cost per sale by channel
- First and last touch
- Real revenue, not platform estimates

Move budget toward ads that pay
A home decor brand running ads can see which ones pay for themselves and move budget toward them.
- Ads ranked by real return
- Wasted spend flagged
- Budget decisions in minutes

Revenue was $21.4k, up 9% on last week.
Search ads brought the most sales at $14 each. Display ads cost $61 per sale.

A weekly summary in your inbox
A short weekly summary lands in your inbox with the key numbers explained in plain words.
- The numbers that matter
- What changed and why
- Read in two minutes
What it looks like in your business
Ads that pay for themselves get the budget

Real revenue per ad shows where the next dollar should go.



How we build your dashboard
Show us how it works today
On a call, we look at where your sales and ad data live and the questions you can't answer today.
We connect your data and build the views
Store, ads and analytics are connected, and the dashboard shows the numbers you decide on.
Weekly summaryMon
Sales up 9%AlertThu
Display ads over targetData refreshed7:00
All channelsNumbers update, you decide
The dashboard keeps itself current, and the weekly summary explains what changed.
Questions & answers
How do I see cost per sale by channel?
Sales are matched to the channel that brought them, and each channel's spend is divided by those sales.
Can my store sales be connected to my ad spend?
Yes. Store sales and ad accounts are connected in one dashboard that updates itself.
Can I see which ad a customer came from?
Where tracking allows, each sale is tied back to the ad or channel that brought it.
Why don't the ad platforms' numbers match my revenue?
Platforms estimate their own results. The dashboard uses your actual sales, so you can compare.
Do I need to log in every day?
No. A short weekly summary arrives by email with the key numbers explained.
See how a sales dashboard would work for your business
Tell us where to send it and we'll record a short video demo for your business.